I am leading development teams for Covenant Technology Partners, a consulting firm that heavily leverages Microsoft technologies. My clients are typically new to Agile, and most have never seen a burndown chart before. So I want to keep it simple, showing schedule, scope, and budget in a way that flows with our 2 week sprints. I report on other things, such as progress against themes, and issues/risks, but I'll discuss those another day.
The key difference between the charts below and the simple charts in the first post is that these separate the impact of velocity from scope changes. I can now see how many points the team is burning in each sprint, unclouded by variability in scope.
Burndown Showing Scope As Negative

The blue bars represent the amount of work remaining on the project. Everything above the zero point line is what remains of work added at the start of the project. Everything below the line represents what remains of work added after the start.
The advantage of this over the simple charts is that I can see how the team is performing - every point delivered comes off the top of the chart. Now I can draw a straight (blue) line and get a better idea of velocity.
As stories are added to the project, the bars extended beneath zero. Of course, they can also shrink as stories are removed from scope. I've added a green trend line for scope growth - I'm using a log (curve) not linear (straight) line because I anticipate that most new scope will get added earlier in the project.
What matters most now is not when the blue line crosses zero, but when it intersects with the red dotted line - that is when all stories will be complete.
The drawback of this chart is that the negative growth is unintuitive for many, requiring additional explanation. Also, it seems that I need to add extra sprints in order to show the intersection line (assuming more scope is being added than will fit, which is typical). The problem is that my budget only covers 7 Sprints, but the chart now implies 8.
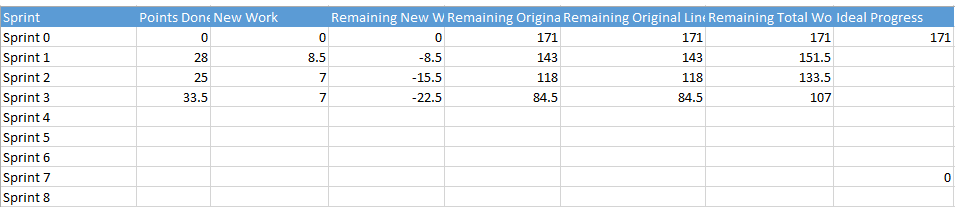
Here's the data behind the chart.
Burndown Showing Scope as Positive


Scope Creep?
Unlike waterfall projects, scope on an Agile project is intentionally fluid. We don't lock the business into a predefined list of deliverables, but instead allow - even encourage - them to modify scope along the way. That means that original vs. new scope is largely irrelevant. (Shocking, I know.)The problem with burndown charts that show scope growth is that they tend to imply that new scope is "extra" - and therefore, bad. Scope creep. When presenting this chart to the business, we have to take care to avoid communicating this. Instead we should state clearly that the only reason for separating out original vs. new scope is that it allows us to track team performance.
What the business wants in the backlog is entirely up to them. They just have to square it with their budget - which in an Agile project equals schedule. In the above example, 30 points will not make it into the project. This is not a bad or unusual thing: as a project moves along new value is envisioned and added in. The key is for the business to prioritize the backlog (in collaboration with the project team), so that the 30 points represent the least important user stories.
No comments:
Post a Comment